Most businesses struggle to gain a clear understanding of their customers’ true experiences as they scale. With numerous touchpoints, increasing response times, and complex customer journeys, it becomes difficult to track what’s working and where problems arise.
Here, a customer experience (CX) dashboard provides a solution by consolidating all key customer data into a single, easy-to-read, real-time visual tool.
This guide explains the essential steps of building a powerful and effective customer experience dashboard, from defining your key performance indicators (KPIs) to choosing the right visualization tools and ensuring your dashboard drives meaningful action.
✨ Key Takeaways
- A customer experience dashboard centralizes vital metrics like CSAT, NPS, CES, and FCR to give teams a real-time view of the entire customer journey.
- Businesses can build effective CX dashboards by defining clear objectives, integrating existing tools, and designing user-friendly visualizations.
- Tracking customer engagement KPIs such as customer satisfaction, effort score, and retention rate helps identify areas that need improvement.
What is a customer experience (CX) dashboard?
A customer experience (CX) dashboard is a visual representation tool that tracks and displays key metrics related to customer interaction with businesses. It collects and presents data from multiple sources, such as live chats, surveys, website visits, support calls, and emails.
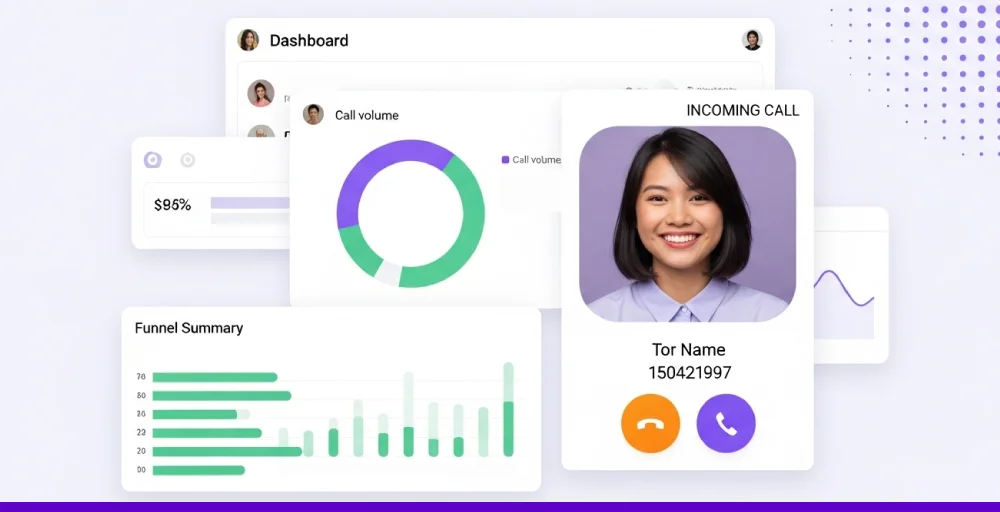
With a CX dashboard, companies gain a real-time view of the customer journey, which helps to identify what’s working, what’s not, and where improvements are needed. Instead of going through spreadsheets or multiple platforms, teams can access all relevant customer experience data in one centralized place.
A CX dashboard supports businesses in monitoring key metrics such as satisfaction score (like CSAT or NPS), response time, and churn rates.
Customer experience dashboard examples
A single dashboard isn’t enough to visualize the multiple facets of customer experience. Businesses need to create different views to monitor key metrics. Let’s look at some major customer experience dashboard examples:
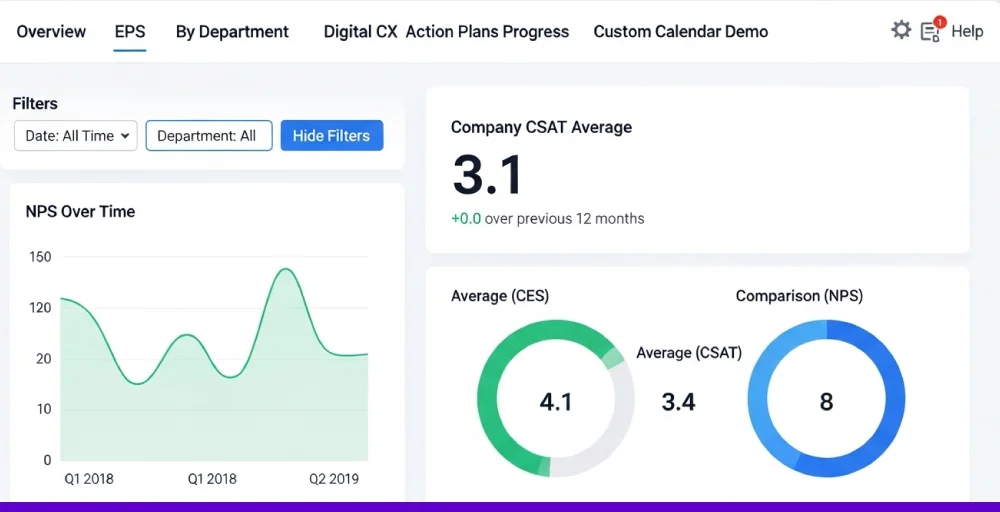
1. Customer experience KPI dashboard
A customer experience KPI dashboard displays key metrics to evaluate your team’s customer support effectiveness. The key metrics include the customer satisfaction score (CSAT), net promoter score (NPS), customer churn rate, first contact resolution (FCR), and average handle time (AHT).
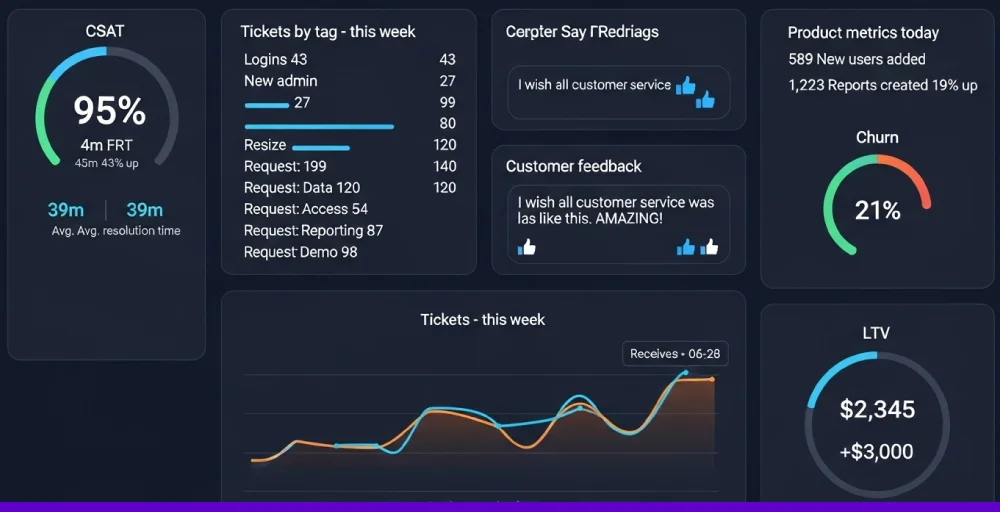
The visual representation shows line charts trends over the past 12 months, large scorecards for the current quarter’s KPIs, and a bar chart comparing churn rates to the previous year.
The dashboard helps managers monitor agent performance, spot issues early, and improve service quality.
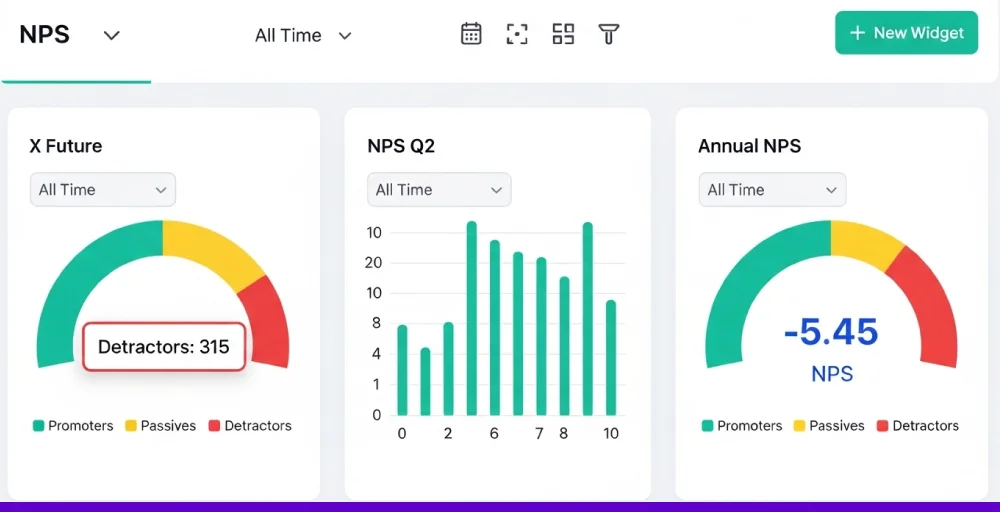
2. Product engagement dashboard
A product engagement dashboard is a visual tool that monitors customer feedback and how users interact with a product or service.
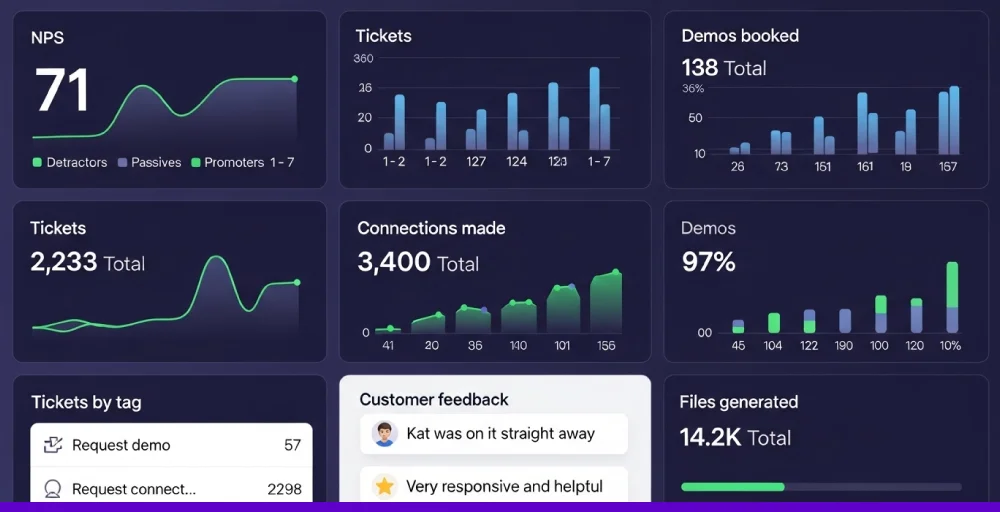
The dashboard displays essential KPIs like active users, session duration, feature usage, retention rate, and conversion metrics to track how customers engage with your product over time.
With detailed customer experience insights, companies can understand user behavior, identify popular features, spot drop-off points, and optimize the product experience to increase engagement.
3. The support manager dashboard
A support manager dashboard is a centralized tool designed to provide a comprehensive overview of the customer support team’s performance. It visualizes key metrics such as ticket volume, average response time, resolution rate, agent workload distribution, and customer satisfaction score (CSAT).
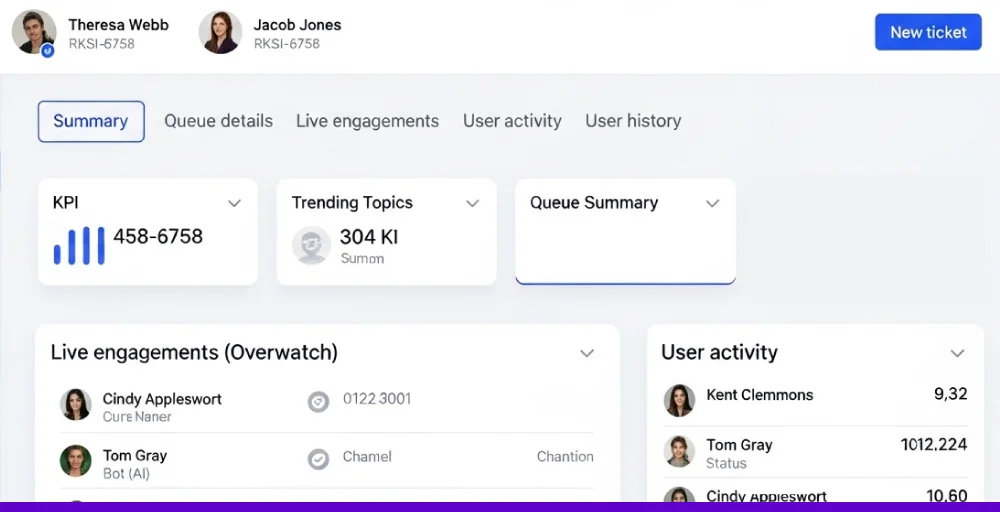
Beyond just numbers, this dashboard enables support managers to spot trends, uncover performance gaps, and proactively address issues before they escalate.
The support manager dashboard also helps with agent coaching, shift planning, and service level adherence, ensuring that every customer receives consistent, timely, and high-quality support.
Why your business needs a customer experience dashboard?
Viewing data in a spreadsheet can be challenging because it’s harder to interpret. That’s why a customer experience dashboard is necessary, as it visually presents all the essential data.
Here’s why business needs a customer experience dashboard:
- Improved decision-making with actionable insights: A customer experience dashboard consolidates critical customer data and helps track customer experience metrics into a single, intuitive interface. It gives managers or teams a clear view of how customers perceive their brand, helping to make informed decisions.
- Enhanced customer satisfaction and loyalty: Monitoring customer experience closely allows you to respond more effectively to customer needs and expectations, leading to increased customer satisfaction.
- Streamlined reporting for teams: A CX dashboard automates data collection and reporting, making it easy for everyone to access up-to-date, accurate information at any time.
- Streamline operations to increase revenue: Businesses can identify inefficiencies and bottlenecks in customer interactions that may be costing the business money. Addressing these issues helps companies to reduce operational costs.
Essential metrics to track on a customer experience dashboard
Monitoring and measuring important call center metrics is necessary for every business. The effective CX dashboard collects and presents the right KPIs.
Companies can generate and review metrics across three key categories: operational performance, customer perception, and business results.
1. Operational performance
These metrics measure how effectively your internal teams understand the influence of your operational performance on the customer experience.
- Average response time: The average time taken to respond to a customer after they raise a ticket. Shorter times reflect prompt service.
- Average resolution time: The average time it takes to resolve an issue entirely. It helps assess team efficiency and process effectiveness.
- First contact resolution (FCR): The percentage of issues resolved during the first interaction. High FCR means fewer follow-ups and better efficiency.
- Agent utilization rate: Measures how much time agents spend actively handling tickets versus idle time.
- Agent workload distribution: Tracks how tickets are distributed across team members.
2. Customer sentiment and loyalty indicators
These metrics offer a complete overview of customer perceptions of your brand, the ease of resolving their issues, and their likelihood to stay loyal.
- Customer satisfaction score (CSAT): Measures customer satisfaction after a support interaction, typically via a simple rating (e.g., 1–5 stars).
- Customer effort score (CES): Captures how easy or difficult it was for a customer to get their issue resolved. Lower effort equals a better experience.
- Net promoter score (NPS): Asks how likely a customer is to recommend your brand to others. High NPS indicates strong loyalty and satisfaction.
- Customer retention rate: Measures how many customers continue doing business with you over a given period.
- Churn rate: The percentage of customers who stop using your product or service.
3. Financial and business performance indicators
These metrics reflect how well your company is performing, including revenue growth, customer retention, profitability, and market share expansion.
- Customer lifetime value (CLV): Estimates the total revenue a customer is expected to generate during their relationship with your company.
- Customer acquisition cost (CAC): The average expense incurred to gain a new customer helps assess marketing and sales efficiency.
- Profit margin: The percentage of revenue that remains as profit after all expenses, showing overall financial health.
- Churn rate: The percentage of customers lost during a given time, impacting recurring revenue and growth.
- Return on investment (ROI): Evaluates the profitability of investments or campaigns relative to their cost.
How to build an effective customer experience dashboard?
An effectively designed CX dashboard is crucial for tracking and monitoring essential metrics, pinpointing areas for improvement, and supporting data-driven decision-making.
Here are the key steps to create a powerful CX dashboard:
1. Define objectives and select relevant metrics
Start by clearly outlining the objectives of your CX dashboard. Determine what you want to achieve, whether it’s improving service efficiency, increasing customer satisfaction, or reducing churn. Defining objectives will guide the choice of essential and relevant metrics.
2. Integrate your existing tools
The CX dashboard requires data to show visually. Integrate your existing systems, such as CRM, call center software, and feedback platforms, for a comprehensive view. The platforms should include a two-way contact sync feature, as it facilitates easy data transfer.
3. Design for clarity and usability
Keep the dashboard intuitive and straightforward. Use clear visualizations like line charts for trends, bar graphs for comparison, and scorecards that allow users to understand important insights quickly. Always focus on the most significant metrics that matter to your team to avoid clutter.
4. Implement real-time monitoring
The CX dashboard should provide real-time data to enable quick identification and resolution of issues. Incorporate live data feeds so your dashboard reflects the most current information. These real-time insights allow your team to respond swiftly to emerging problems and adjust strategies as needed.
5. Adjust your dashboard to accommodate growth
Look for a solution that makes it easy to customize views, apply filters, and build reports that fit your unique goals. The best platforms grow with your business, integrating smoothly with new tools and helping you stay aligned as your strategy evolves.
A flexible, scalable CX dashboard ensures you’re always focused on the right KPIs, no matter how fast things change.
Best practices for using a customer experience dashboard
Understanding best practices is essential to getting the most out of the CX dashboard. Here are five best practices you must know:
- Define clear goals from the start: First, define your goal and what you want to measure and improve in the customer journey. Setting defined objectives helps focus your dashboard on what matters most. Without clear goals, your data may lack direction and impact.
- Choose metrics that drive action: Tracking the right key performance indicators (KPIs) is important. Measure customer engagement KPIs like CSAT, NPS, churn rate, or first contact resolution. These metrics reveal customer satisfaction and help pinpoint areas that need attention.
- Tailor dashboards for each role: Different teams need different insights. An executive requires big-picture results, while managers need operational details. Customize views so users only see what’s relevant to them.
- Make data easy to understand: Use clear charts, clear labels, and plenty of white space to avoid clutter. Keep simple visuals that help users quickly interpret trends and patterns. If a chart doesn’t serve a purpose, it shouldn’t be on the dashboard.
- Keep data accurate and up to date: Your dashboard is only as good as the data behind it. Connect it to reliable, real-time sources and maintain consistent metric definitions, ensuring teams are working from trustworthy, consistent performance.
How does KrispCall help craft the perfect CX dashboard?
Creating an effective CX dashboard requires accurate, real-time insights from every customer touchpoint. To extract the data, you need an all-in-one cloud telephony platform.
An advanced customer experience management (CXM) solution like KrispCall captures every interaction, such as calls, recordings, voicemail, call tags, and more, in one centralized place, giving you a full picture of your customer journey. With built-in tools like live call monitoring, call tagging, and detailed analytics, KrispCall helps you track what matters most.
Everything is unified and ready for visualization in your dashboard. Plus, seamless CRM and helpdesk integrations make it easy to connect conversation data with team performance.
Stop guessing, start optimizing your customer experience with KrispCall’s all-in-one CX dashboard. Get started today!