To run a sales team, contact center, or customer support operations effectively, a call center dashboard is essential.
These are useful to deliver exceptional customer service, as they show the call volumes, response time, agent performance, and other metrics of your business.
Call center dashboards are a must in modern call center operations to get a real-time view of your contact center and identify the areas that need improvement.
In this blog, we will explore call center dashboards, their key metrics, and examples, and learn about some of the best practices on how to build a call center dashboard.
✨ Key Takeaways
- A call center dashboard is a visual reporting tool that shows the real-time view of contact center metrics and key performance indicators (KPI).
- Key metrics of a call dashboard are average handle time (AHT), first call resolution (FCR), customer satisfaction score (CSAT), average speed to an answer, call abandonment rate, call volume & trends, and real-time vs. historical metrics.
- Best practices for building an effective call center dashboard are customization, real-time updates, filtering and drill-down, and alerts and notifications
What is a call center dashboard?
A call center dashboard is a visual tool that shows the most important metrics for your customer support team in one place. It tracks information like call volume, wait times, and agent performance, often using simple charts or graphs.
The purpose of a call center performance dashboard is to help managers and team leaders monitor performance in real time and make quick decisions to improve service. By spotting trends or issues as they happen, your team can respond faster and keep customer experiences smooth.
Key metrics every call center dashboard should track
Though each call center metrics dashboard is different, some key performance metrics are standard in all contact center dashboards that are useful to improve the performance of your call center technology.
These are the key metrics that help to track and monitor call center agent performance:
1. Average handle time (AHT)
Average handle time measures how long it takes for an agent to complete a call from start to finish, including any follow-up work after the call ends. It gives a clear picture of how efficiently your team is handling customer conversations.
Tracking AHT helps you spot areas where agents may need support or additional resources. While shorter times can mean faster service, it’s also important to balance speed with quality to keep customers happy.
2. First call resolution (FCR)
First contact resolution, also known as first call resolution (FCR), shows how often a customer’s issue is fully solved during the first call, without any follow-ups or transfers. It’s a clear sign that your support is efficient and customer-focused.
When FCR is low, it usually means agents are rushing calls or lack the tools to fix problems fast. Tracking this metric helps you spot where support is falling short and where training or system changes are needed.
3. Customer satisfaction score (CSAT)
CSAT measures how happy customers are with the support they received. After a call or chat, customers are asked to rate their experience, usually through a quick survey. It’s a simple but powerful way to gauge how well your team is doing.
Low scores can be an early sign of bigger problems, like poor service or rising churn rates. While response rates can be low, tracking CSAT over time still gives you insight into what’s working and what’s not. Some businesses even use AI tools to predict CSAT automatically, which helps them see the full picture without waiting for surveys.
4. Average speed to answer (ASA)
ASA shows the average amount of time it takes for a call center agent to answer an incoming customer call after entering the queue. It’s basically the average wait time before someone picks up. Shorter wait times lead to happier customers and less frustration.
If your ASA is high, it could mean you’re understaffed or your team isn’t managing time well. Tracking this metric helps you spot busy periods and adjust staffing or workflows. It’s one of the fastest ways to improve the customer experience without changing your whole process.
5. Call abandonment rate
Call abandonment rate tracks how many customers hang up before reaching an agent. It usually happens when wait times are too long or when the hold experience is frustrating. High abandonment means missed chances to help, and possibly lost business.
While it’s tough to bring this number down to zero, keeping it low should still be a priority. Tracking this metric helps you understand when and why people are giving up. It’s a signal that your queue times or call diversion may need some fine-tuning.
6. Call volume & trends
Call volume tells you how many calls your team is handling, and when they’re coming in a given time period. Looking at daily, weekly, or monthly call volume and patterns helps you spot busy times and prepare for them. It’s one of the easiest ways to stay ahead of demand.
By tracking call trends, you can staff smarter, reduce wait times, and avoid burnout. It also helps explain performance dips and uncover what’s behind long hold times or missed calls. Over time, this data becomes your secret weapon for better planning and service.
7. Real-time vs. historical metrics
Real-time metrics show what’s happening right now, such as how many callers are waiting or how long the current hold times are. They help managers make quick decisions on the spot, like reassigning agents or jumping into calls. It’s all about fixing problems as they happen.
Historical metrics look at patterns over days, weeks, or months. They reveal deeper trends, like which days are busiest or which agents consistently perform well. You need both views to balance fast reactions with long-term improvements.
Call center dashboard examples
Some of the examples of a call center agent dashboard are given below:
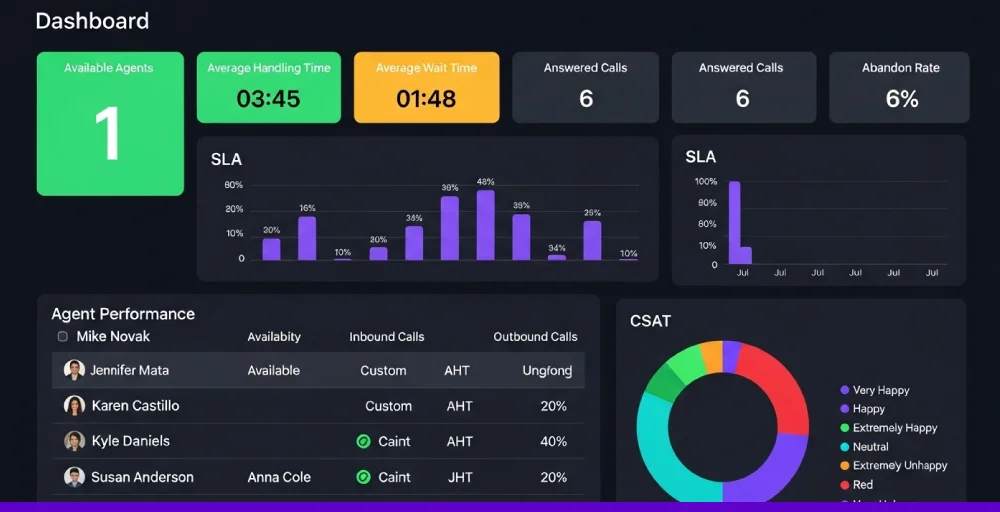
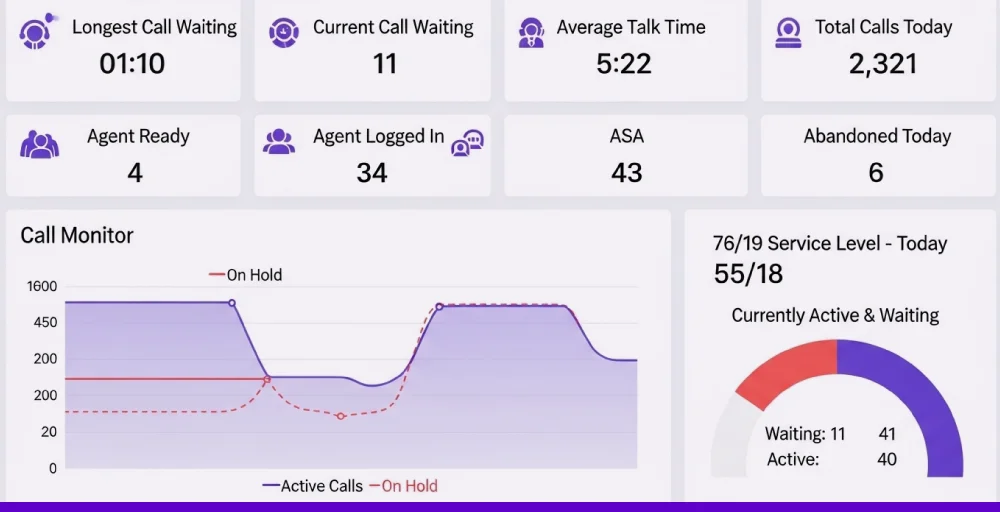
1. Live wallboard
A live wallboard shows real-time data your team can act on, such as the number of calls in a queue or which agents are available. It keeps everyone in sync and helps spot issues before they grow. With it, agents can even track their own performance during the day.
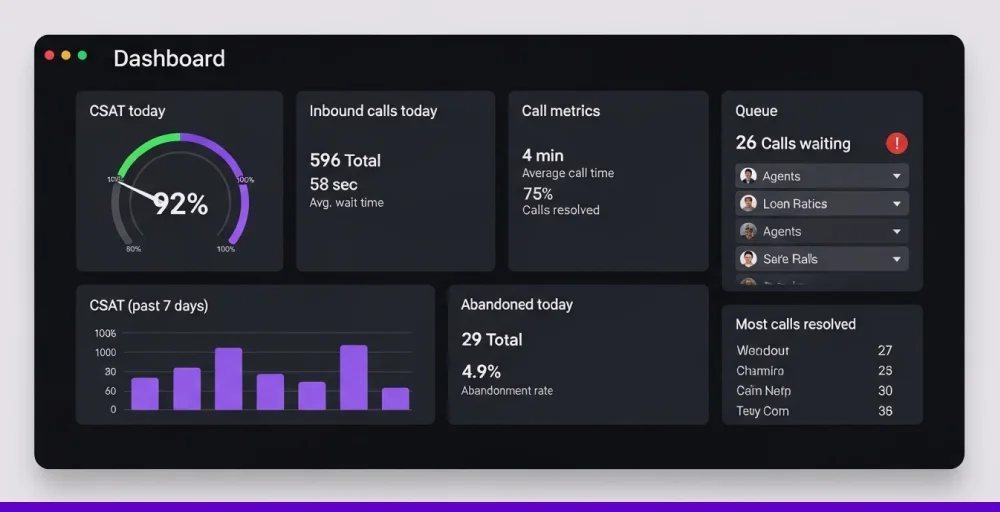
Supervisors use wallboards to monitor call center health at a glance. It also has metrics like wait time, abandon rate, and agent activity that show what’s going right or what needs fixing fast. It’s a simple tool that drives both awareness and accountability.
2. Historical call center KPIs and metrics
Looking back at past data helps managers see what’s working and what’s not. A call center dashboard with historical KPIs shows patterns in performance, which makes it easier to spot issues before they grow. It’s a handy way to guide staffing and call flow decisions.
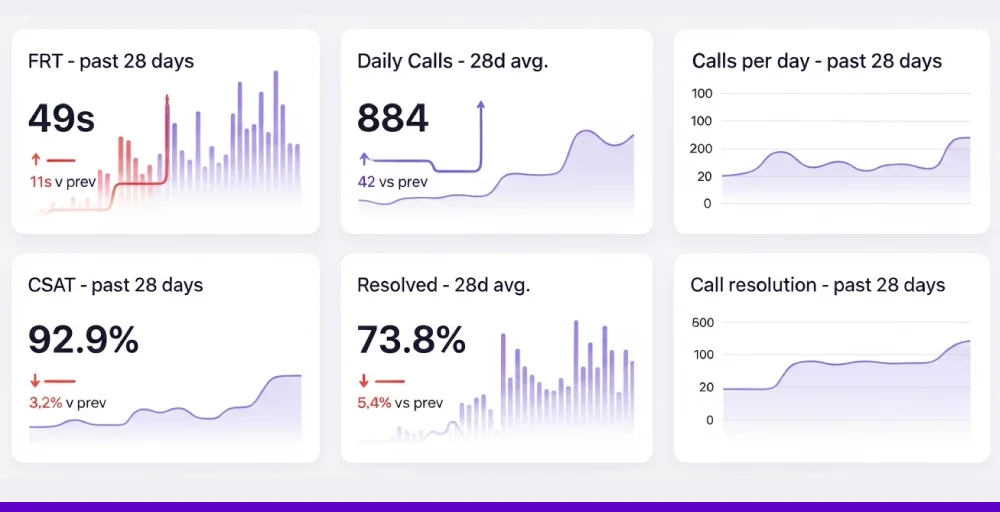
These dashboards can highlight changes in customer satisfaction, call resolution, or handle times. If CSAT drops or calls take longer, it could mean agents need extra support. Tracking these trends helps you stay one step ahead.
3. Channel mix
A good call center agent performance dashboard shows where your customer conversations are happening and at every touchpoint. Whether it’s phone, email, chat, or social media, knowing the mix helps you put the right people on the right tasks. It also tells you if certain channels are underused or overstaffed.
If most of your traffic is coming through one channel, it’s a signal to adjust your team. You might shift agents or rethink where to invest next. This kind of visibility keeps your support smooth and responsive.
Related 👉: Best Call Center Software in Jamaica
Best practices when building your call center dashboard
Building a call centre dashboard requires identifying your needs and focusing on insights to ensure accuracy, reliability, and call center productivity. Some of the best practices of a call center dashboard include:
1. Use customization
No two call center software systems are the same, so your dashboard shouldn’t be either. Customizing the layout and metrics makes sure each team member sees what matters most to them. A supervisor might need queue stats, while agents focus on personal performance.
You can also match the dashboard to your company’s look and feel. Use colors or sections to highlight teams, goals, or key alerts. And by linking it with tools like your CRM, you get the complete picture in one place.
2. Use real-time updates
In a busy call center, timing is everything. Real-time dashboards let you spot issues as they happen, whether it’s a surge in call volume or a drop in agent availability. Quick action can make the difference between solving a problem and losing a customer.
You can set how often your call center dashboard refreshes based on your needs. Monitor live agent activity to offer support when it’s needed most. With constant updates, you stay in control, even when things get hectic.
3. Use filtering and drill-down
A good call center KPI dashboard doesn’t just show you the numbers; it helps you explore them.
Call center features like IVR, CRM integrations, and auto attendant, filters let you narrow in on what matters, whether it’s a specific team, call type, or time period. That way, you can quickly spot what’s working and what’s not.
Drill-down tools take it a step further. Click into a metric to uncover what’s driving the trend, like one IVR option getting all the traffic. These layers of insight help you make smarter, faster decisions.
4. Alerts and notifications
Staying on top of call center performance means acting fast when something slips. With alerts built into your dashboard, you’ll know right away if a key metric dips, like rising wait times or a drop in CSAT. This early warning helps you respond before the issue grows.
You can set custom alerts based on what matters most to your team. Choose how you want to be notified, whether it’s a pop-up, email, or SMS. Furthermore, add escalation rules so the right people get involved at the right time.


How to design an effective call center dashboard?
To design an effective call center analytics dashboard, you should focus on precise objectives, relevant metrics, and user experiences. Try to follow the given step-by-step process:
1. Identify key metrics and goals
Start by talking to the people who use the dashboard every day, such as agents and managers. Ask what slows them down, what decisions they make daily, and what information they wish they had quicker. Their answers will show you exactly which metrics to focus on.
Next, link those metrics to real business goals. For example, if you’re trying to cut wait times, track the average speed of answer and call abandonment rates. If customer satisfaction is the goal, focus on CSAT scores, first-call resolution, and post-call feedback.
2. Involve decision-makers in dashboard design
Bring in team leaders, QA managers, and even frontline agents early in the design process. Ask them to sketch out what they’d want to see on their screen during a shift. This helps you build something that’s actually useful, not just good-looking.
Run short feedback sessions with each group using simple mockups or prototypes. Let them click around, suggest changes, and point out what’s missing. Their input makes sure the final dashboard fits real workflows, not assumptions.
3. Follow best practices for visualization and layout
Put the most important metrics at the top or in the center where they’re easy to spot. Use large, readable numbers for KPIs like call volume, wait time, net promoter score (NPS), or CSAT. Group related data, like agent activity and call queues, so users don’t have to jump around.
Use colours with purpose, like red for urgent issues and green for targets met. Group related data together, for example, agent stats in one area and customer feedback in another. Keep the layout clean so anyone can read it quickly, even during a busy shift.
4. Ensure data accuracy and reliability
Connect your dashboard call center directly to trusted sources like your call management system, CRM, or ticketing tool. Avoid manual data entry wherever possible, as it’s slow and often leads to errors. Set up automatic data syncing to keep numbers fresh and consistent.
Test the dashboard regularly by comparing it to raw reports or exports. If something doesn’t match, trace it back to the source and fix it fast. Even small gaps in accuracy can lead to wrong decisions and missed targets.
Related 👉: Best Call Center Software in SriLanka
Dashboarding made simple with KrispCall
Managing your call center’s performance is easy with KrispCall’s intuitive dashboards.get real-time visibility into every aspect of your operations, from the number of incoming and outgoing calls to missed calls, total call volume, and average call duration.
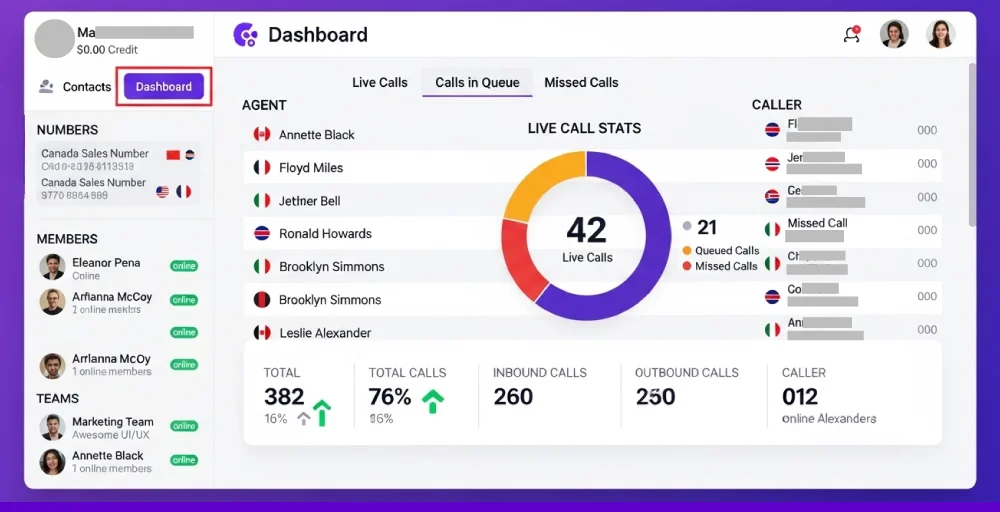
KrispCall’s dashboards let you track essential call metrics at a glance, helping you monitor agent activity, identify performance gaps, and respond proactively to trends before they impact service. Whether it’s spotting a spike in missed calls or noticing a drop in call duration, you can make informed decisions quickly.
By using KrispCall, you can replay past conversations, review detailed call logs, and track performance trends over time, all in one place. With KrispCall, you ensure consistent service quality while scaling your team with confidence.
Gain a clear view of your call center’s performance with KrispCall’s simple dashboards. Start with KrispCall now.